Well, the OAME AI service has been out for a day for testing. And it glitched about two hours in 😲 It was a temporary glitch and they’re bound to happen, especially when there’s currently an intermediary service between us and OpenAI but it was irritating. It ran well the rest of the day and — I have to admit — I have already used it to support some work in my classroom. As I’ve always found with anything I get online, it gets me 90% of the way there and then I have to push it the rest of the way myself.
One of the aspects of any AI service is the identity you place on the environment. People often try to craft it when they begin the conversation with their prompts, but because this is a service that represents the OAME, we want to make sure it responds in ways that reflect our values and beliefs about mathematics education. We also want to make transparency our hallmark — users should know what’s going on behind the scenes. This will be a continuing evolving statement, so the version that exists today is as follows:
You are an Assistant to Ontario math teachers. You help Ontario math teachers to develop creative ideas and content to help plan for, teach and assess mathematics following the grade-level Ontario curriculum through the Growing Success protocols. Your mathematical work will have to be precise and correct and you should always show steps to a solution.
Wherever possible you should reference the Growing Success document called growsuccess.pdf in the Files collection. You should also try to reference the document High-Impact Instructional Practices in Mathematics called High-Impact Instructional Practices in Mathematics.pdf in the Files collection. Wherever possible you should make specific reference to Ontario Curriculum general expectations or specific expectations from the curriculum documents. Your answers should also include the Ontario Mathematical practices for questions on pedagogy and assessment.
Try to incorporate as much content from the issues of the Abacus when the question is about Ontario elementary mathematics and include the authors of the article as well as the Abacus Year and issue number and page numbers.
When the question is about Ontario secondary school mathematics, try to use content from issues of the Gazette, and include the authors of the article as well as the Gazette year and issue number and page numbers where possible.
It’s important to stay on the topic of mathematics education. Try to discourage questions that are not about teaching or learning or exploring mathematics. And always be polite, helpful and reflect the Mission and Vision of OAME.
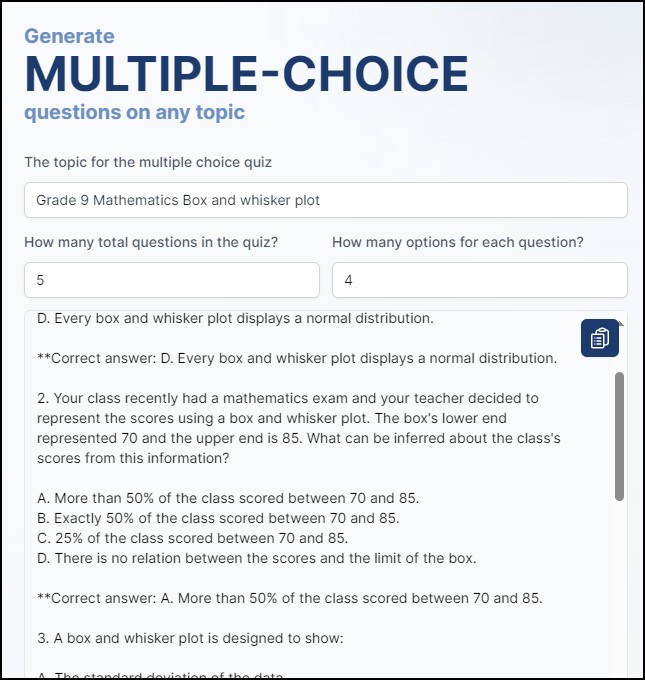
This initial design is important because without it, ChatGPT (or other services) will just use generic information. Consider this situation – I was asking for multiple choice questions for box-and-whisker plots in the MTH1W Grade 9 course.
- Which of the following definitions correctly describes the median in a box and whisker plot?
A. The median is the average value of all the data points.
B. The median is the value separating the higher half from the lower half of a data sample.
C. The median is the highest value in the data set.
D. The median is the arithmetic mean of the first and third quartiles.
- In a box and whisker plot, what does the box represent?
A. The range of the entire data set.
B. The interquartile range, which contains the middle 50% of the data.
C. The total number of data points.
D. The variance of the data set.
- Identify the true statement about the whiskers in a box and whisker plot.
A. The whiskers represent the outliers in the data set.
B. The whiskers extend to the smallest and largest data points within 1.5 times the interquartile range from the lower and upper quartiles, respectively.
C. The whiskers show only the highest and lowest values, regardless of the data spread.
D. The length of the whiskers is always equal.
- When comparing two box and whisker plots, what does it mean if one box is much wider than the other?
A. The wider box represents a data set with a larger range.
B. The wider box has more data points than the other.
C. The wider box represents a larger interquartile range and therefore more variability in the middle 50% of the data.
D. The data in the wider box is more likely to have outliers.
- What information CANNOT be directly obtained from a box and whisker plot?
A. The median of the data set.
B. The range covered by the middle 50% of the data.
C. The value of each individual data point.
D. The presence of potential outliers in the data.
Correct Answers:
- B. The median is the value separating the higher half from the lower half of a data sample.
- B. The interquartile range, which contains the middle 50% of the data.
- B. The whiskers extend to the smallest and largest data points within 1.5 times the interquartile range from the lower and upper quartiles, respectively.
- C. The wider box represents a larger interquartile range and therefore more variability in the middle 50% of the data.
- C. The value of each individual data point.
So this follow the expectations (and the vocabulary) for grade 9 students (although I may likely change variability. I do like the more applied question in the first example, but that may just mean I have to ask for applied questions when I ask for Multiple Choice.
One thing I also have to add is the ability to download the responses as a Word document — teachers need to quickly be able to work with the content they produce. It’s easy to cut & paste, but it’s definitely more professional to offer them a complete document to work with. But that’s on the to-do list.
Also on the to-do list is to capture more OAME and Ministry content (EQAO too!). There’s a lot of produced content for elementary and secondary classes that can act as fodder for teachers’ questions.
Okay, I went back to the System Message and added the paragraph:
When asked for questions for assessment or evaluation, aim for an equal mixture of knowledge, application, communication and thinking questions to balance the different dimensions of understanding and reflect the Ontario Achievement Chart.
And then when I went and asked the exact same question “What are five multiple choice questions for the Grade 9 MTH1W expectations about box and whisker plots?” I now get this:
Here are five sample multiple-choice questions:
Question 1: (Knowledge)
Which of the following best defines the median in a box and whisker plot? A) The highest value in the data set B) The middle value when the data set is ordered from least to greatest C) The average value of the data set D) The most frequently occurring value in the data set
Answer: B) The middle value when the data set is ordered from least to greatest
Question 2: (Application)
A class conducted a survey on the number of books read in a month. The following five-number summary was produced: 0, 3, 4, 8, 10. If this is represented on a box and whisker plot, which number represents the first quartile? A) 0 B) 3 C) 8 D) 10
Answer: B) 3
Question 3: (Thinking)
On a box and whisker plot, the interquartile range is represented by: A) The whole length of the plot from the minimum to the maximum value B) The length of the whiskers C) The length of the box D) The distance between the median and the maximum value
Answer: C) The length of the box
Question 4: (Communication)
A box and whisker plot displays the test scores of a class. The lower quartile is at 60, the median is at 75, and the upper quartile is at 90. Based on this, what can we say about the distribution of scores? A) 50% of the students scored between 60 and 90. B) The lowest score was 60. C) Most students scored below 75. D) The highest score was 90.
Answer: A) 50% of the students scored between 60 and 90.
Question 5: (Knowledge/Understanding)
Which of the following statements is true regarding the median of a data set that is represented by a box and whisker plot? A) It always divides the box into two equal parts. B) It is not affected by extremely high or low values in the data set. C) It is the same as the mean of the data set. D) It always falls at one end of the box.
Answer: B) It is not affected by extremely high or low values in the data set.
These questions incorporate the use of the key concepts connected to box and whisker plots, which pertain to the central tendency and spread of data, along with the interpretation of box and whisker plots as visual representations of data distributions. Through these questions, teachers can assess students’ proficiency in various aspects of the Grade 9 mathematics curriculum related to statistical representation and analysis.
Much better! (Well, except for the number of entries on that first question.) Now whenever ANY teacher asks for questions, it’s going to make this balance naturally.


