This builds on my earlier post (link here).
After my session at the OAME Conference (link to Presentation), a few folks asked me how I had put this together, so I’m going to give a brief run-down here. You’re always welcome to ask me for more information, of course, if I’ve been too brief.
I used Microsoft PowerApps — it’s a quick-and-dirty way to make an app that uses your existing data and then you can muck around with the data, add more and then store it somewhere else.
What’s nice is that the Apps are universal — they work on the laptop, iPad, iPhone & Android phones. There’s a web app version so they will work on a Chromebook too!
PowerApps are meant for quick development and refinement and for most users and applications in schools
it’s free. If you’re not an Office365 school, or if your school blocks you from using PowerApps, you can sign up for your own Office365 just as a faculty member! (
link here) It gives you access to the web-versions of Office as well as all the online spaces of Office365 so much more powerful than GoogleDocs/Drive on its own — and you can do your own PowerApps, Classnotebooks, Sites, you name it! (I could go into a long story about how I started this project almost two years ago but lost all my work when IT shut down my access to PowerApps but I’m not going to.) You also have access to the power of Azure and Cortana intelligence — but be careful, there’s a cost there (ask me how I know thi$).
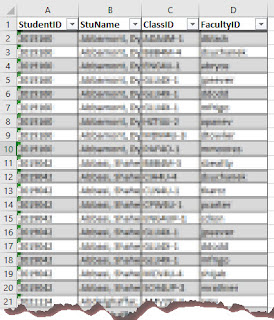
I needed one set of data to start —
who was in each course and who taught that course. That is easy to put together — a quick Excel spreadsheet of student names, codes, course code & teachers. I also needed the
Course Expectations — I only wanted the General Ones but, since it’s in an Excel spreadsheet, I can edit/add expectations all I want! I also created a smaller Excel for the
Learning Skills so that I could track those at the same time (I used to use a Microsoft Form but this ties it together –
link to blog post.)
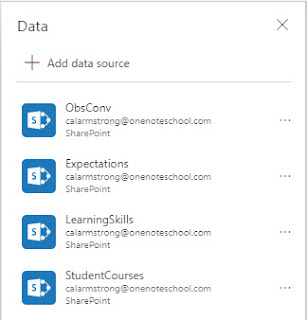
Then I needed someplace to put the data once I collected it. There are
a lot of options here … you could leave it as an Excel spreadsheet. I’m just using an Office365 Site List — which I can download as an Excel spreadsheet to work with. This means I never touch the real data; I always work with a copy. I also create a Picture Library to store the pictures in, and put a link to each picture in my Site List. I don’t imagine I’ll use the pictures a lot — they’re just there for backup to reinforce my comments/assessment.
One caveat to the teachers who use the app — since I don’t do any image compression, they want to be on wifi as it pushes those pictures up to Office365! So all the data is stored in 4 lists, 3 of which are pretty much static (I haven’t dealt with students adding/dropping courses or teachers changing… this is meant to be quick & dirty so that may be a manual edit of your class list in Excel.)
Now off I go to PowerApps … it’s an option when you visit http://www.office.com and log in with your Office365 account … or you can go there direct at the http://powerapps.microsoft.com site. I started from scratch because this started as an experiment in learning PowerApps and got accelerated when a teacher said he wanted the app done yesterday. Remember, there’s always an easier way than what I do 🙂
The PowerApps programs are based on “screens” so I have two screens:
1) a “choose a teacher/course” screen which asks which teacher is using the app and then, from the Excel spreadsheet, the app pulls up the courses for the teacher and they select the one they’re in at that moment.
2) a “create an observation/conversation entry” screen which collects a picture, choose the students, sets the expectation/learning skill, gives a 0-5 rubric number and adds a comment.
The main sequence is RED — Choose the student (1) and the General Expecation (2), assign a value to the observation/conversation (3) since the Ministry Inspector wants us to be able to say if/how it affects their reported grade (0 indicates you’re not giving them a value obviously and then we use a 1-5 rubric at my school) then write a comment (4) in the Rich Text field since we sometime like to add emphasis and click SAVE (5). This pushes all this data into the List on Office365. If you want to do a Learning Skill instead of an Expectation, tap the SWAP button (1) and you’ll see the Learning Skills list.
You can add a picture by tapping the picture (1) and then the capture button (2). That puts the image you captured in the middle of the screen (3) so that if you don’t like what you have you can capture a new one. No, you can’t do more than one picture right now but it’s not an impossible change. I thought about adding audio (an easy add) but video is another issue entirely.
That’s it! The CLEAR button and the X button are used to either re-use the picture/comment for another student (if they’re working on the same problem or involved in the same conversation, say) or reset the entire screen.
Now, the coding goes on each of the objects on each screen. To give you an idea, here’s the first screen:
The initial text box, nothing happens! But when they type in their teacher id and tap OK, then it stores whatever is in the box to the variable for TeacherID, and, at the same time, the Course List gets updated from the Excel spreadsheet of Student/Courses/Teachers to only show those courses from this particular teacher. When the teacher selects a course from the now-filled dropdown list and taps OK, then the app stores the courseID into the variable for CourseID and also sends them off to the next screen where they fill in the Comment.
Now, yes, this is the easiest screen so I’ll pull apart the next screen in my next blog post.


